

环境
Linux:Ubuntu 14.04.2 LTS
Java:1.8.0
Elasticsearch安装
Elasticsearch(以下简称ES)是一个基于Lucence的搜索服务器,具有高效的实时分析能力,搭建ES需要安装Java环境,设置好JAVA_HOME参数即可.
1)下载ES(本例为2.2.0)
2)解压后在根目录执行以下命令启动ES
bin/elasticsearch
3)检查是否安装成功
curl -X GET http://localhost:9200
返回以下信息则搭建成功
{
  "name" : "Prodigy",
  "cluster_name" : "elasticsearch",
  "version" : {
    "number" : "2.2.0",
    "build_hash" : "8ff36d139e16f8720f2947ef62c8167a888992fe",
    "build_timestamp" : "2016-01-27T13:32:39Z",
    "build_snapshot" : false,
    "lucene_version" : "5.4.1"
  },
  "tagline" : "You Know, for Search"
}
Kibana安装
Kibana是一个数据可视化平台,它可以让你通过惊艳、强大的制图进行数据交互.
1)下载Kibana(本例为4.4.0)
其他版本下载(注意Kibana版本是否兼容你所安装的ES版本)
https://www.elastic.co/downloads/kibana
2)配置Kibana
配置文件位于conf/kibana.yml,你可以配置kibana的服务端口(默认:5601),更重要地,请确保elasticsearch.url配置正确(默认:http://localhost:9200)
3)安装kibana插件(非必须)
以sense为例(非常方便的Elasticsearch交互插件)
注意:请确保Kibana版本不低于4.2.x,ES不低于2.x
# 自动安装最新版的sense
./bin/kibana plugin --install elastic/sense
4)启动Kibana
注意:请确保ES已经启动
bin/kibana
5)访问Kibana
http://yourhost:5601
Logstash安装
Logstash是一个为高效处理日志、事件和非结构化数据源并提供多种输出(包括Elasticsearch)而设计的用于数据收集、浓缩、转换和传输的开源工具
注意:Logstash需要jdk1.7以上
1)下载Logstash
2)配置Logstash实例
一个Logstash实例一般由一个或多个input、filter(可选)、output插件组成
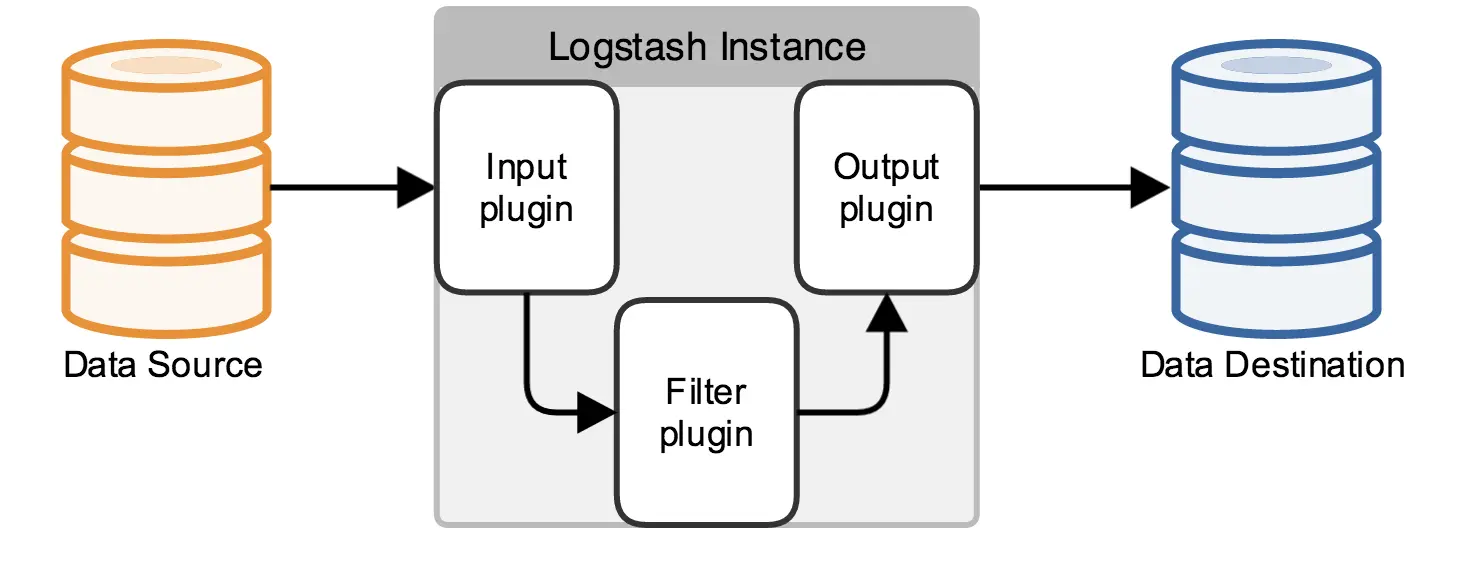
图:基础的Logstash实例(via www.elastic.co)
配置文件结构
input {
}
# optional.
# filter {
#
# }
output {
}
Input:消费指定数据源的数据,即作为数据输入窗口
Filter:数据修改,过滤,结构化等处理
Output:数据输出目标
3)Logstash采集nginx日志并存入ES
3-1 从Nginx日志文件读取日志信息
input{
        file {
                path => "/path/to/access.log"
                start_position => beginning
                sincedb_path => "/your/path/to/.sincedb-file"
        }
}path: 要读取的日志文件
start_position: 指定从日志文件的第一行开始读取,默认是end,即相当于tail -f
sincedb_path: sincedb文件用于记录当前读取到文件的哪个位置,当你关闭Logstash后,下次启动时会从这个文件读取这些信息来确定从哪开始,如果删除本文件,将从start_position开始,默认位置($HOME/.sincedb-*)
3-2 过滤nginx日志
首先需要知道nginx日志定义的格式
例如:
log_format main '$request_time|$host|$remote_addr|$remote_user|[$time_local]|$request|'
                    '$status|$body_bytes_sent|$http_referer|$http_x_forwarded_for|'
                    '$upstream_addr|$upstream_status|$upstream_response_time|'
'"$http_user_agent"|$request_body';通过grok插件格式化日志信息
filter {
        grok {
                match => {'message' => '%{NUMBER:exec_time}\|(%{HOSTNAME:host}|-)\|%{IPORHOST:client_ip}\|(%{USER:remote_user}|-)\|\[%{HTTPDATE:timestamp}\]\|%{WORD:verb} %{URIPATHPARAM:request} HTTP/%{NUMBER:http_version}\|(%{NUMBER:response}|-)\|(?:%{NUMBER:bytes}|-)\|(%{URI:referrer}|-)\|(%{IPORHOST:x_forwarded_for}|-)\|(%{DATA:upstream_addr}|-)\|(%{NUMBER:upstream_status}|-)\|(%{NUMBER:upstream_response_time}|-)\|(%{QS:agent}|-)\|(%{DATA:body}|-)'}
                remove_field => ['path', 'message', 'type', 'body', 'http_version', 'upstream_response_time', 'upstream_addr', 'upstream_status', 'bytes', 'remote_user']
        }
}match:设置日志内容的匹配格式,以及对应的字段映射(这些字段会出现在ES的document中)
remove_field:移除不关心的字段
3-3输出到ES
output {
        elasticsearch {
                hosts => ["localhost:9200"]
                index => "logstash-index-name-%{+YYYY.MM.dd}"
                document_type => "access-logs"
        }
}hosts:ES的url
index:ES索引名,以天来划分
document_type:索引文档的type值
3-4检验配置是否正确
bin/logstash -f your-config.conf --configtest
4)启动Logstash
bin/logstash -f your-config.conf
稍等片刻日志就会导入到ES

至此,ELK集结完毕,更详情介绍请参考官方GuideLine